
345 under-25s in Stratford district were claiming in August, the most in at least five years. The total rose 80 to 1,870, ending four months of falls.
345 people aged under 25 in Stratford-on-Avon district were claiming unemployment-related benefits in August, the highest figure in at least five years. Nothing in the monthly series back to September 2021 reaches that number.
The district total rose too. It stood at 1,870 in August, up 80 on July’s 1,790, which ends four months of falls. That is the highest August figure since 2021, and 230 more than in August last year.
All of it comes from the ONS claimant count published through Nomis, table NM_162_1, released on 15 September.
The rise is at the two ends of working life
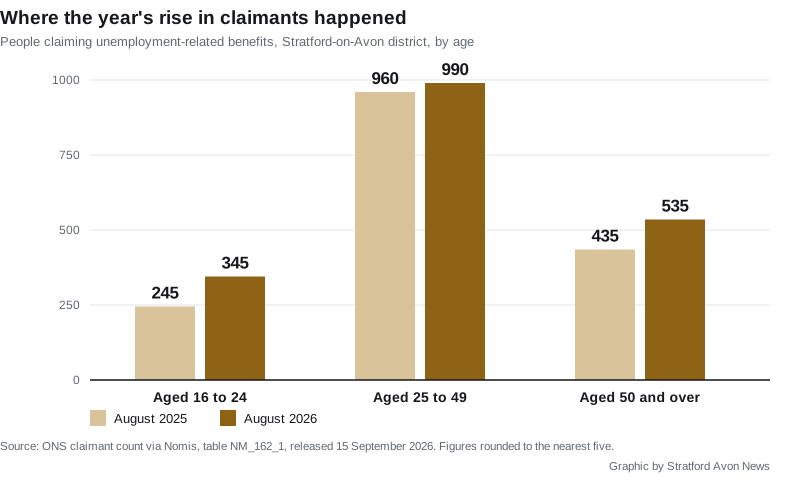
Compare August with the same month a year ago and the age split does the explaining.
- Aged 16 to 24: 345, up 100 on 245
- Aged 25 to 49: 990, up 30 on 960
- Aged 50 and over: 535, up 100 on 435
The middle group is by far the biggest, and it accounts for only 30 of the 230 rise. The other 200 sit with the under-25s and the over-50s.
The under-25 figure is the one to watch. Over the past 13 months it has risen nine times, fallen twice and held steady twice, taking it from 245 to 345. Every month since November 2025 has been higher than any month between September 2021 and October 2025, when the highest reading was 300. The 50-and-over figure has been at or above 535 only in March and April this year, and before that not since April 2022.
It is still the lowest rate in Warwickshire
At 2.2 per cent of residents aged 16 to 64, Stratford-on-Avon has the lowest claimant rate of the county’s five districts and boroughs.
| Area | Rate |
|---|---|
| Stratford-on-Avon | 2.2% |
| Warwick | 2.5% |
| Rugby | 2.9% |
| North Warwickshire | 3.0% |
| Nuneaton and Bedworth | 4.2% |
| Warwickshire | 3.0% |
| West Midlands region | 5.3% |
| United Kingdom | 3.9% |
So the district is not in trouble by any national comparison. What has changed is the direction. In August 2025 the count was 1,640, within five of where it had been the previous June and July. Over the 12 months since, it has risen in eight months and fallen in four, on balance adding 230.
What it means for you
If you are claiming, or helping someone who is, the practical points are these.
- The count includes people in work on Universal Credit who are required to look for more work, not only people with no job at all. A rise does not automatically mean 80 more people out of work.
- The under-25 figure matters most for school and college leavers. Last year it rose by 25 in September and another 20 in October, so the next two releases will say more about this autumn’s leavers than August’s figure does.
- Warwickshire County Council runs employment and skills support through the Warwickshire Skills Hub.
- The September figures are due next month. We will update this page when they land.
If you are looking at the district’s economy more widely, our pages on Stratford house prices and council tax bands carry the other two figures that move household budgets here.
What this number is, and what it is not
The ONS is direct about the limits of this measure in its Claimant Count quality and methodology information. It is “a measure of the number of people claiming benefits principally for the reason of being unemployed, based on administrative data from the benefits system”, and it “does not attempt to measure unemployment, which is a concept defined by the International Labour Organisation (ILO) as all those who are out of work, actively seeking work and available to start work”.
Two other things follow from that page. Figures for small areas are “rounded to the nearest five for publication”, which is why the three age bands above add to the headline total rather than to something a few units off it. And the Universal Credit part of the count “allows for revisions to the data for one previous month”, so the newest figure in any release is the one most likely to move.
That has already happened to a figure we published. On 12 August we reported June’s count as 1,845. The revised series now records June as 1,795, 50 lower. Our correction is at the foot of this page.
Sources
- ONS claimant count via Nomis, dataset NM_162_1, for the district series, the age bands and the Warwickshire, regional and UK rates. The August 2026 figures were released on 15 September 2026. The five-year comparison uses the 60-month series to August 2026 for the 16 to 24 band and the 72-month series for the total.
- ONS Claimant Count quality and methodology information for the definition, the ILO comparison, the rounding rule and the revisions policy.
Correction, 19 September 2026. Our report of 12 August gave the June 2026 claimant count for this district as 1,845, which was the figure published at the time. The ONS has since revised June down to 1,795. The earlier article has been annotated rather than rewritten.
Have your say