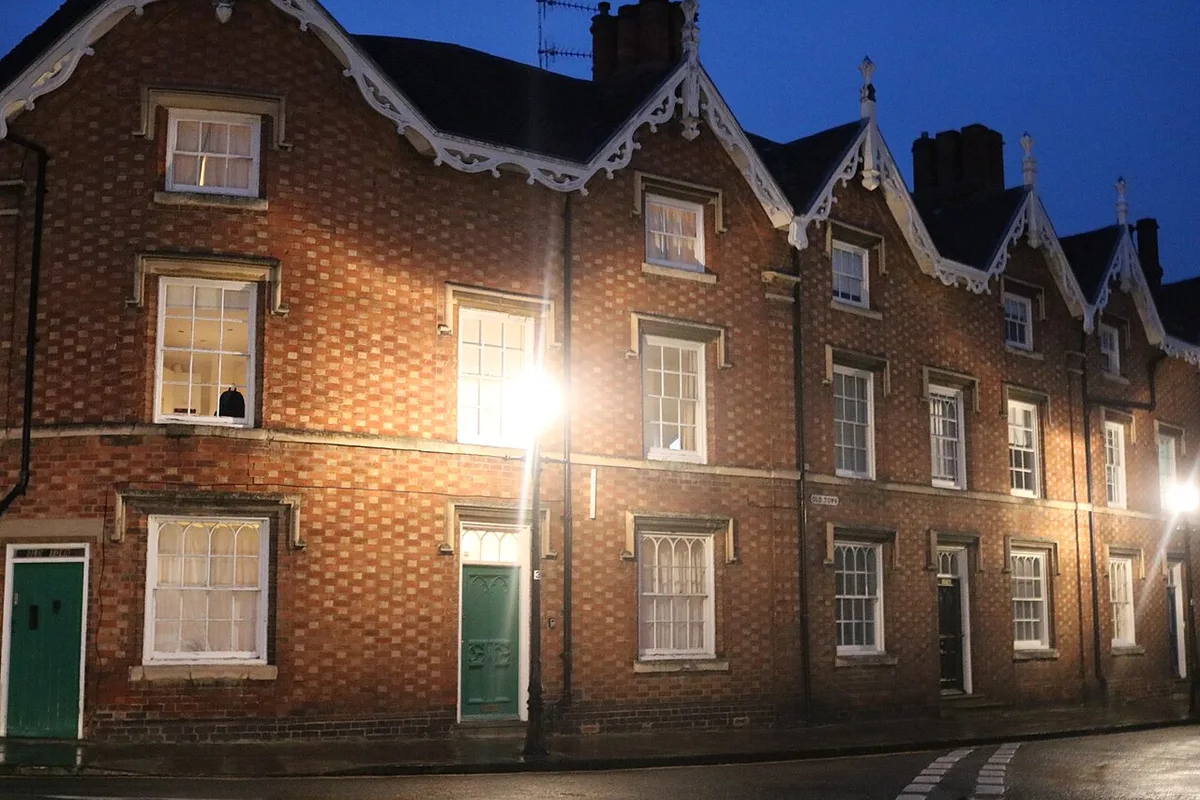

The average Stratford-on-Avon district home sold for £392,574 in June 2026, a third monthly fall. Prices by property type, and how the district's towns compare.
Two numbers circulate for Stratford house prices and they are nearly £45,000 apart. Both are correct. They measure different things, and knowing which is which is most of the argument. This page reads the sold-price record for the district and the towns inside it: the official average, what each property type costs, how many homes are actually changing hands, and why a Henley-in-Arden detached house costs more than double the average Alcester home.
The quick answer
The average home in Stratford-on-Avon district sold for £392,574 in June 2026, according to the UK House Price Index, which is built from completed HM Land Registry sales rather than asking prices. That is up 1.4% over twelve months, behind England’s 1.8% and behind Warwickshire’s 2.7%.
The district is enormous and mostly rural. It runs from Studley and Alcester in the north west through Henley-in-Arden and Bidford-on-Avon to Wellesbourne, Southam and Shipston-on-Stour, so that single figure averages a Regency town house in Stratford with a semi in Southam. For the town itself, Rightmove’s rolling-year sold prices put Stratford-upon-Avon at £437,248, up 5% on the year and roughly level with the town’s 2022 peak of £436,309.
One caveat worth keeping. The district average has now fallen for three months running, by 0.1% in April, 0.5% in May and 1.0% in June, and sits £6,652 below the record £399,226 it reached in March 2026. Month-to-month movement in a district this size is noise, driven by which homes happened to complete, and every month is revised later. The twelve-month direction is the signal. Our June house price report has the full picture.
What it means for you
If you are selling, the constraint is volume, not price. The district recorded 135 completed sales in April 2026, the most recent month with a confirmed count, against 146 in each of February and March. That is a functioning but thin market, and well below the 205 to 210 a month it was running at through the autumn of 2025. Homes priced against 2022 hopes sit; homes priced against this year’s sold record move.
If you are buying, a 1.4% annual rise means waiting is not free, but nor is there a stampede. Flats are the one soft category, down 0.4% over the year, which makes the entry rung the most negotiable part of the market. Two running costs are worth pricing before you commit: parking, if you are moving into the town centre, and the commute, because Stratford has no direct daytime train to London and the season ticket is over £11,000.
If you are staying put, your home has gained a little over 2% in a year unless it is a flat, and semi-detached houses have done best of all at 2.4%.
Prices by property type
The spread between the top and bottom rungs is more than £415,000. These are the Stratford-on-Avon district averages for June 2026 from the UK House Price Index:
- Detached houses: £603,986, up 0.7% on the year. Much of the district’s stock, and most of what sells in the villages.
- Semi-detached houses: £366,948, up 2.4%, the fastest riser of the four.
- Terraced houses: £290,117, up 2.3%. Everything from town-centre cottages to post-war rows in the market towns.
- Flats and maisonettes: £188,888, down 0.4%, the only category to fall.
A first-time buyer in the district paid an average of £304,437 in June 2026, up 2.0%. A home mover, someone selling one property to buy another, paid £468,003. The roughly £163,500 gap between those two figures is the size of the step from a first flat or terrace to a family house here.
New build is its own market. In April 2026, the most recent month the index splits it out, a new home in the district averaged £488,767 against £388,170 for an existing property, a premium of about 26%. In June, buyers paying cash averaged £383,701; those buying with a mortgage averaged £397,633.
Where the district’s towns sit
The town-level picture is not a neat ladder down from Stratford. Henley-in-Arden is within £14,000 of Stratford, while Alcester, twenty minutes away, averages £129,000 less.
Stratford-upon-Avon averages £437,248, up 5% on the year, with detached homes at £705,008, semis at £409,342 and terraces at £352,328. It is the only one of the four towns to have got back to its 2022 peak.
Henley-in-Arden averages £423,821 but is down 2% on the year and sits 6% below its 2022 peak of £450,452. Its detached average of £726,167 is the highest of any town in the district, higher even than Stratford’s, which is what a Green Belt village high street with big houses behind it looks like in the data.
Shipston-on-Stour is the surprise at £396,732, up 6% and 1% above its 2022 peak, the strongest twelve months of the four.
Alcester averages £308,454, down 2% and 8% below its 2023 peak of £335,315. Its terraced average of £265,892 is the cheapest route into a house anywhere in the district’s main towns.
| Area | Average price | Annual change | Basis |
|---|---|---|---|
| Stratford-upon-Avon | £437,248 | +5% | Rolling year, town |
| Henley-in-Arden | £423,821 | -2% | Rolling year, town |
| Shipston-on-Stour | £396,732 | +6% | Rolling year, town |
| Stratford-on-Avon district | £392,574 | +1.4% | UK HPI, June 2026 |
| Warwick district | £372,922 | +4.7% | UK HPI, June 2026 |
| Warwickshire | £308,618 | +2.7% | UK HPI, June 2026 |
| Alcester | £308,454 | -2% | Rolling year, town |
| England | £293,262 | +1.8% | UK HPI, June 2026 |
| West Midlands | £234,731 | +3.3% | UK HPI, June 2026 |
The two bases disagree on direction for three of the four towns, and that is worth understanding rather than smoothing over. The official index compares like-for-like properties month by month and says the district is up 1.4%. The rolling-year town averages simply average whatever sold, so they fall when the mix shifts toward smaller homes. Read together: underlying values are rising modestly, while in Henley-in-Arden and Alcester the type of home changing hands has got smaller.
Why the district costs more than Warwickshire
Stratford-on-Avon district sits £83,956 above the Warwickshire average and about £99,000 above England. Three things hold it there.
The first is scarcity of supply, not London commuting. Unlike Leamington or Warwick, Stratford has no fast rail link to the capital, so this is not a commuter premium in the usual sense. It is a shortage of land coming forward: the district has permission for only 3,825 homes as at April 2025 against a requirement for 27,800 by 2050, which is the arithmetic driving the South Warwickshire Local Plan.
The second is the visitor economy, which supports a town-centre property market that behaves more like a small city than a market town, and which also takes stock out of residential use.
The third is the north of the district being Green Belt. Henley-in-Arden, Studley and the Arden villages are inside the West Midlands Green Belt, which has constrained building there for decades and shows up as those £726,000 detached averages.
Frequently asked questions
What is the average house price in Stratford-upon-Avon?
For the town, Rightmove’s rolling-year sold prices give £437,248. For the whole district, the official UK House Price Index gives £392,574 for June 2026. The district figure is the more reliable measure of movement; the town figure is the better guide to what a Stratford address costs.
Are Stratford house prices going up or down in 2026?
Up over the year, down over the last three months. District prices rose 1.4% in the year to June 2026, behind England at 1.8%, but the average has fallen in each of the three months since March. Flats are the only property type cheaper than a year ago, down 0.4%.
How much is a detached house in Stratford-on-Avon district?
A detached house averaged £603,986 in June 2026, up 0.7% on the year, and roughly 1.6 times the price of the average semi-detached home in the district. In Stratford-upon-Avon town the detached average is £705,008, and in Henley-in-Arden it is £726,167.
Which is the cheapest town in the district?
Of the four main towns, Alcester at £308,454 on rolling-year averages. Its terraced average of £265,892 is the lowest entry point of the four.
How many homes are actually selling?
The district recorded 137 completed sales in March 2026, the most recent month with a confirmed volume, against 131 in February and 155 in December 2025. Sales volumes are always the last figure to firm up because they depend on registrations.
Where can I check what a specific house sold for?
Every completed sale in England and Wales is public. Look up any street or address free on the HM Land Registry Price Paid service, or browse the same data on Rightmove and Zoopla.
Sources
- UK House Price Index, Stratford-on-Avon district (ONS / HM Land Registry) for the district average, property-type, buyer-type and annual-change figures.
- HM Land Registry UKHPI open data for the June 2026 Stratford-on-Avon figures, the matching Warwickshire, Warwick district, West Midlands and England benchmarks, and the UK HPI full file for June 2026 (CSV) for sales volumes and the new-build, cash and mortgage averages.
- Rightmove sold-price pages for Stratford-upon-Avon, Henley-in-Arden, Shipston-on-Stour and Alcester for rolling-year town averages and by-type breakdowns.
- South Warwickshire Local Plan, Publication draft, July 2026 for the district’s housing requirement and existing commitments.
- HM Land Registry Price Paid search to check any individual address.
Figures are provisional and revised as more sales complete. Monthly index figures and rolling-year town averages cover different areas and periods, so they are not directly comparable. Always confirm the latest numbers against the linked HM Land Registry sources before making a decision. Checked August 2026.
Have your say