
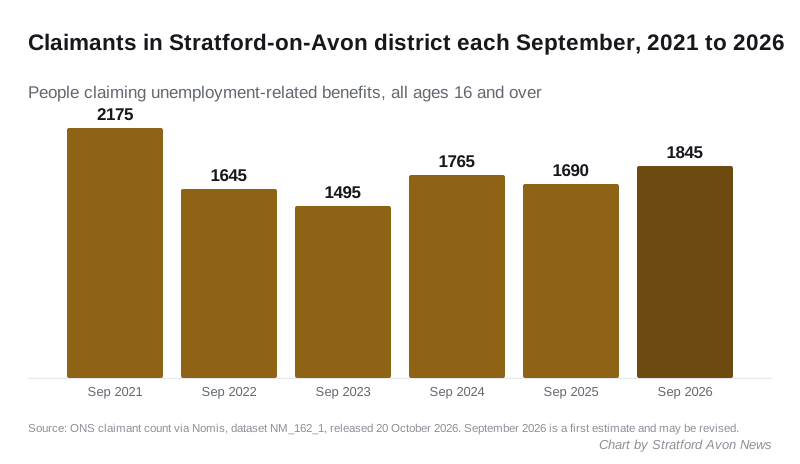
1,845 people in Stratford district claimed in September, 155 more than a year ago and the most for a September since 2021. Under-25s rose to 350.
1,845 people in Stratford-on-Avon district were claiming unemployment-related benefits in September. That is 155 more than in September 2025, a rise of about 9 per cent. It is the highest September figure since 2021.
The count rose by 30 on August, and it has now risen for two months in a row.
The figures are from the ONS claimant count published through Nomis, released on Tuesday 20 October.
Most of the year’s rise is under-25s
Set September against the same month last year and the age bands show where the 155 came from.
| Age | September 2025 | September 2026 | Change |
|---|---|---|---|
| 16 to 24 | 270 | 350 | up 80 |
| 25 to 49 | 965 | 980 | up 15 |
| 50 and over | 455 | 515 | up 60 |
| All ages | 1,690 | 1,845 | up 155 |
The under-25 figure of 350 is the joint highest since July 2021. It was 340 in August.
That matters because September is when school and sixth-form leavers start to appear in the count. Last year the band rose by 25 in September and by 20 more in October, so the November release will show whether this autumn follows the same path.
Still the lowest rate in Warwickshire
The district’s claimant rate is 2.2 per cent of residents aged 16 to 64. That is the lowest of the county’s five districts and boroughs. Every area in the table below rose on August except Rugby, which held at 2.9 per cent.
| Area | Rate, September 2026 |
|---|---|
| Stratford-on-Avon | 2.2% |
| Warwick | 2.5% |
| Rugby | 2.9% |
| North Warwickshire | 3.0% |
| Nuneaton and Bedworth | 4.3% |
| Warwickshire | 3.0% |
| West Midlands region | 5.4% |
| United Kingdom | 3.9% |
So the rise here is part of a wider one, not something peculiar to south Warwickshire.
Treat the newest month with care
The September figure is a first estimate. The ONS says the Universal Credit part of the count “allows for revisions to the data for one previous month”, in its Claimant Count quality and methodology information.
In this district the revisions have recently all gone one way:
- June was first published as 1,845. It now stands at 1,795, 50 lower.
- August was first published as 1,870, the figure in our report last month. It now stands at 1,815, 55 lower.
If September moves the same way, the true rise on the year will be smaller than 155. We will say so when the October figures come out.
What it means for you
- The count includes people in work on Universal Credit who are required to look for more work. A rise does not mean 155 more people with no job at all.
- Small-area figures are rounded to the nearest five, so a change of five or ten in one age band is within the rounding.
- Employment and skills support in the county is listed on the Warwickshire Skills Hub.
- The October figures are due on Tuesday 17 November 2026, according to the ONS labour market bulletin.
For the other numbers that shape household budgets here, see our pages on Stratford house prices and council tax bands.
Sources
- ONS claimant count via Nomis, dataset NM_162_1, for the district series, the age bands and the Warwickshire, regional and UK rates. Released 20 October 2026. The September comparison uses the 72-month series to September 2026.
- ONS Claimant Count quality and methodology information, for the definition, rounding and revisions policy.
- ONS labour market overview, October 2026, for the release date and the next release.
Have your say