
Police logged 264 crimes and anti-social behaviour reports within a mile of central Stratford in August, against 208 a year earlier. Which types rose, and where.
Police recorded 264 crimes and anti-social behaviour reports within a mile of central Stratford-upon-Avon in August 2026. That is 56 more than in August 2025, a rise of 27%, and 27 more than in July. Anti-social behaviour was the largest category, and reports mapped to the theatre more than doubled.
The figures are the Home Office’s street-level data on police.uk, published this week for August. We pull everything within one mile of the town centre, so the area takes in the riverside, the Maybird retail park and the station as well as the shopping streets. Each report is placed at the nearest street or landmark, not an exact address. One month is a small sample, and August is peak visitor season, so treat the comparison with last August as the fairer one.
What was reported
| Type | August 2025 | August 2026 | Change |
|---|---|---|---|
| Anti-social behaviour | 61 | 78 | +17 |
| Violence and sexual offences | 61 | 69 | +8 |
| Shoplifting | 20 | 27 | +7 |
| Criminal damage and arson | 21 | 20 | -1 |
| Public order | 15 | 20 | +5 |
| Other theft | 11 | 14 | +3 |
| Burglary | 4 | 10 | +6 |
| Vehicle crime | 7 | 9 | +2 |
| Robbery | 1 | 6 | +5 |
| Drugs | 5 | 3 | -2 |
| Other | 2 | 8 | +6 |
| Total | 208 | 264 | +56 |
“Other” groups bicycle theft, theft from the person, possession of weapons and other crime, each of which was five or fewer in both months.
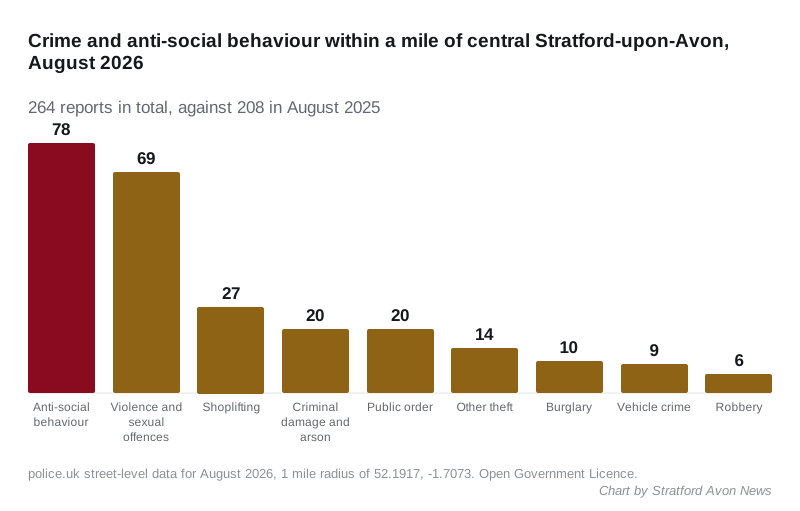
Anti-social behaviour drove most of the rise. It accounts for 78 of the 264 reports, up from 61. Police do not record an outcome for anti-social behaviour, so none of those reports will ever show as solved or closed.
The small categories need care. Robbery went from one report to six, and burglary from four to ten. Those are real increases, but at this scale a single incident shifts the picture, so neither is evidence of a trend on its own. Our year-to-July analysis is the better measure for anything with fewer than 20 reports a month.
Where it happened
The ten locations with the most reports in August 2026, as police.uk names them:
| Location | August 2025 | August 2026 |
|---|---|---|
| Parking area | 26 | 29 |
| Theatre or concert hall | 10 | 22 |
| Shopping area | 16 | 16 |
| Bridge Street | 9 | 13 |
| Supermarket | not in top ten | 10 |
| Shakespeare’s Birthplace coach terminal | not in top ten | 9 |
| High Street | not in top ten | 8 |
| Sheep Street | not in top ten | 8 |
“Parking area”, “shopping area” and “supermarket” are police.uk’s generic labels for a car park, a retail area or a store rather than a named street. The retail park on Regal Road, which topped the named-street list over the full year, does not appear in August’s top eight by name, though some of its reports are likely to be inside the “parking area” and “supermarket” totals.
The theatre is the clearest change: 22 reports, up from 10 in August 2025 and 15 in July 2026. The data does not say what they were, and a landmark label means “on or near”, so it covers the surrounding Waterside and Bancroft Gardens area as well as the building.
What happened next
Of the 264 reports, 78 were anti-social behaviour with no outcome category. For the 186 crimes:
- 96 were still under investigation when the data was published
- 40 were closed because police were unable to prosecute a suspect
- 37 were closed with no suspect identified
- 12 were awaiting a court outcome
Most August cases are still open, so those numbers will change as the Home Office updates the file in later months.
What it means for you
- If you report anti-social behaviour: it goes into these figures, which is partly why August, with the town full, is the busiest month. Reports with no outcome are not ignored; the category simply has no outcome field.
- If you park in town: the “parking area” label has been the single biggest location every month this year. Leave nothing visible in the car. Our parking page lists the town centre car parks.
- For the trend: one month up 27% after a year down 2% is not yet a reversal. September’s data is due in late November, and we will update then.
Source: police.uk street-level crime data for August 2026 and August 2025, within one mile of 52.1917, -1.7073, downloaded on 10 October 2026 under the Open Government Licence.
Have your say