
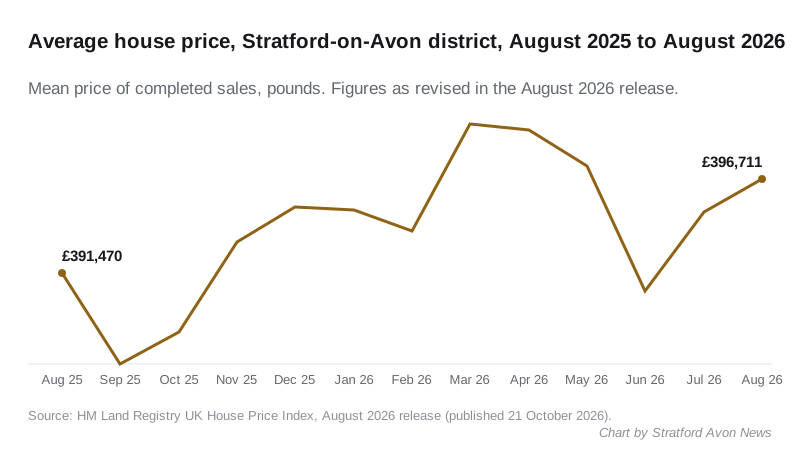
The district average rose 0.5% in August to £396,711, but yearly growth is 1.3%, down from 6.1%. Sales in June were a third lower than a year earlier.
The average home in Stratford-on-Avon district was worth £396,711 in August, up 0.5 per cent on July. That is £5,241 more than in August 2025.
Prices are rising, but slowly. The annual gain of 1.3 per cent compares with 6.1 per cent a year earlier. The district is still £3,050 below its March peak of £399,761.
The figures come from HM Land Registry’s UK House Price Index for August 2026, published on 21 October. UKHPI is a mean average of completed sales, not a median, so a handful of large sales can move it.
July’s jump was smaller than first reported
Last month we reported that the district average rose 1.5 per cent in July, to £396,753. Land Registry has since revised that. With more July sales registered, the July figure is now £394,858, a rise of 1.1 per cent.
Revisions like this are normal. Early figures rest on fewer completed sales. Our July report now carries a note.
Still the dearest district in Warwickshire
Stratford-on-Avon remains the most expensive place to buy in the county, about £26,000 above Warwick district. The Cotswold district next door, which takes in Moreton-in-Marsh and Chipping Campden, is dearer again at £426,296.
| Area | Average | On the month | On the year |
|---|---|---|---|
| Stratford-on-Avon | £396,711 | +0.5% | +1.3% |
| Warwick | £370,924 | 0.0% | +1.5% |
| Rugby | £278,324 | +2.2% | -2.2% |
| North Warwickshire | £268,337 | -1.3% | +2.5% |
| Nuneaton and Bedworth | £226,730 | -0.2% | -0.2% |
| Warwickshire | £308,148 | +0.4% | +0.5% |
| Cotswold (Gloucestershire) | £426,296 | +1.1% | -2.3% |
| Wychavon (Worcestershire) | £322,210 | +0.2% | -0.4% |
| West Midlands region | £250,731 | +0.2% | +1.2% |
| England | £293,525 | +0.2% | +0.4% |
Over the year, the district’s 1.3 per cent rise beats Warwickshire’s 0.5 per cent and England’s 0.4 per cent. Prices in neighbouring Cotswold and Wychavon are lower than a year ago.
What each type of home is worth
| Type | Average | On the year |
|---|---|---|
| Detached | £609,696 | +1.1% |
| Semi-detached | £370,033 | +2.0% |
| Terraced | £295,080 | +2.2% |
| Flat or maisonette | £190,151 | -1.5% |
Terraced houses rose fastest over the year. Flats are the only type worth less than in August 2025.
A few more figures from the same release:
- First-time buyers paid an average of £307,646, up 1.7 per cent on the year.
- Buyers with a mortgage paid an average of £401,632. Cash buyers paid £388,105.
- Existing owners moving home paid an average of £472,867.
Fewer homes changing hands
Land Registry counts sales with a longer lag than prices. The latest month with a figure is June 2026, when 124 sales completed in the district. In June 2025 there were 190, so that is about a third fewer. May’s count is now 122, against 163 a year earlier.
Those counts can rise as late registrations come in, so treat them as a floor.
What it means for you
If you are selling, the district average has risen about 2 per cent since last October, when it was £388,155. A valuation that assumes the 6 per cent annual rises of a year ago is likely to be optimistic.
If you are buying for the first time, the typical first-time buyer price is about £89,000 below the district average. Flats are the one part of the market where prices are lower than a year ago.
These are district-wide averages. They cover Stratford-upon-Avon, Alcester, Southam, Shipston-on-Stour and the villages, so prices on a particular street can differ a lot. Our house prices page explains how to look up the sold price of a specific home.
Land Registry publishes the September figures next month, and we will report them.
Sources
- HM Land Registry UK House Price Index, Stratford-on-Avon, August 2026, with the monthly records for August 2025 to July 2026 for the trend, the revised July figure and the sales counts.
- The same index for Warwick, Rugby, North Warwickshire, Nuneaton and Bedworth, Warwickshire, Cotswold, Wychavon, the West Midlands and England, August 2026.
UK House Price Index figures are mean averages of completed sales and are revised as more sales are registered. Figures were downloaded on 24 October 2026.
Have your say