
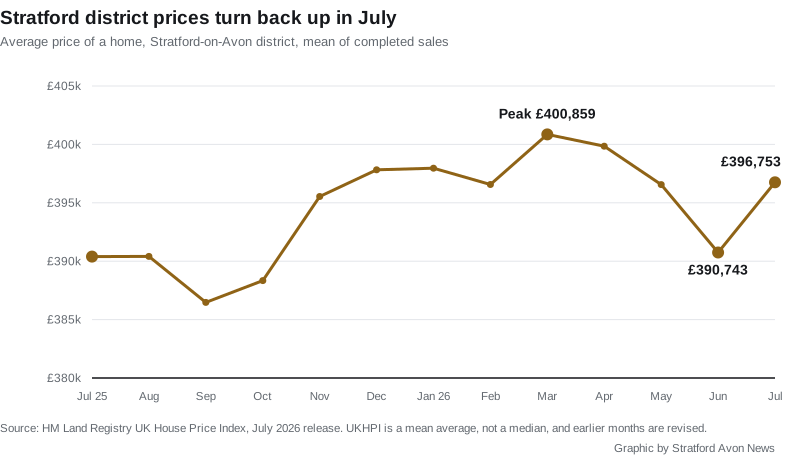
The district average rose 1.5% in July to £396,753, the sharpest rise in Warwickshire and the first gain in four months. Flats are still losing value.
The average home in Stratford-on-Avon district was worth £396,753 in July, up £6,010 on June and the first monthly rise since March. That 1.5 per cent gain was the largest of any Warwickshire district in the month.
It does not undo the spring. The district is still £4,106 below the March peak of £400,859, and the annual rise is down to 1.6 per cent, from 5.6 per cent a year ago.
The figures come from HM Land Registry’s UK House Price Index for July 2026. UKHPI is a mean average of completed sales, not a median, so a handful of large sales moves it. Earlier months are revised as more completions are registered.
Stratford is the dearest district in Warwickshire, and the only one rising fast
Put July’s monthly change next to the neighbours and the district stands out twice: it is the most expensive place in the county to buy, and the only one where prices moved by more than 1.2 per cent either way.
| Area | Average | On the month | On the year |
|---|---|---|---|
| Stratford-on-Avon | £396,753 | +1.5% | +1.6% |
| Warwick | £369,220 | -0.1% | +1.7% |
| North Warwickshire | £273,776 | +1.1% | +5.9% |
| Rugby | £272,696 | -0.8% | -3.5% |
| Nuneaton and Bedworth | £228,142 | -0.5% | +1.6% |
| Warwickshire | £307,489 | +0.2% | +1.0% |
| England | £293,479 | +0.7% | +1.1% |
Two borders are worth noting, because plenty of people here shop across them. Cotswold district, immediately south, averages £421,125, which is £24,372 more than here. Wychavon, immediately west towards Evesham, averages £322,623, which is £74,130 less. Cross the county boundary at Bidford or Shipston and the same money buys a different house.
Flats are the only type losing value
The type split is where the district’s year really shows. Three of the four types gained over the 12 months to July. One did not.
| Type | July 2026 | July 2025 | Change |
|---|---|---|---|
| Detached | £610,973 | £602,545 | +1.4% |
| Semi-detached | £370,391 | £361,267 | +2.5% |
| Terraced | £293,838 | £287,421 | +2.2% |
| Flat or maisonette | £189,898 | £192,479 | -1.3% |
The gap between a flat and a detached house in this district is now £421,075. A detached home here costs 3.2 times a flat.
The first-time buyer average is £307,432, up 2.0 per cent on the £301,507 of a year ago. That is higher than the all-property average in Rugby, North Warwickshire and Nuneaton and Bedworth.
What it means for you
- If you are selling, July’s rise is one month of a mean average, and the annual figure of 1.6 per cent is the more honest guide. The district has been broadly flat for a year, not climbing.
- If you are buying a flat, you are in the only part of this market where the index has gone backwards over 12 months, and the only one that is still below where it was in mid-2025.
- If you are buying a semi or a terrace, those are the two types that rose fastest here, by 2.5 and 2.2 per cent.
- Watch the revisions. June was first published at £392,574 and now reads £390,743, £1,831 lower. July’s figure will almost certainly change as well.
- Sales volumes for June and July are not published yet. The most recent month with a count is May, at 118 sales, against 158 in March and 220 in July last year.
Our Stratford house prices page keeps the longer run of these figures, and the council tax bands page covers the other cost that comes with the house.
Sources
- HM Land Registry UK House Price Index, Stratford-on-Avon district, July 2026, for the district average, the monthly and annual changes, the four property-type averages, the first-time buyer average and the 13-month series in the chart. The same index was read for Warwick, North Warwickshire, Rugby, Nuneaton and Bedworth, Warwickshire, Cotswold, Wychavon and England on the same month.
- The sales volume figures are from the same index. Land Registry publishes them with a longer lag than the price figures, which is why June and July are blank.
UK House Price Index figures are mean averages of completed sales and are revised in later releases. All figures checked against the index on 19 September 2026.
Have your say