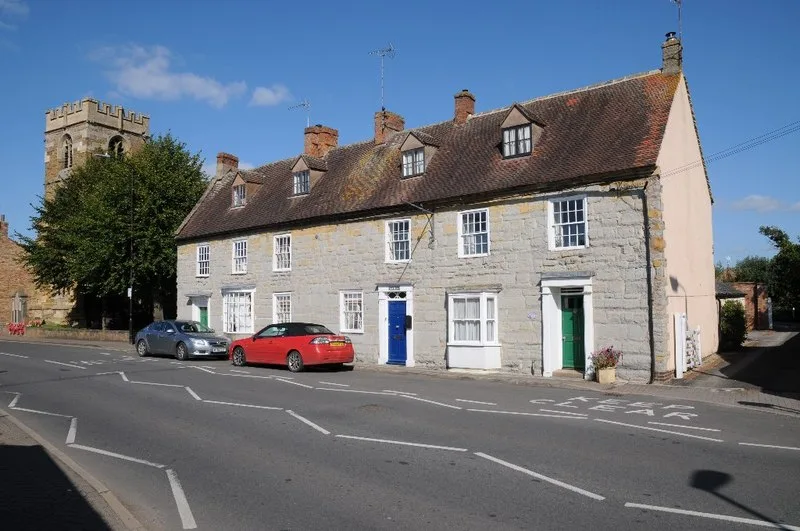

The district average fell 1% in June to £392,574, a third monthly drop and £6,652 off March's peak. Stratford was the only Warwickshire district to fall.
The average home in Stratford-on-Avon district sold for £392,574 in June, down 1.0% on May and the third monthly fall in a row. The district is now £6,652 below the record high it set in March, and it was the only one of Warwickshire’s five districts whose prices fell in the month.
The figures come from the UK House Price Index, published by HM Land Registry on 20 August and built from completed sales rather than asking prices. It is a mean average, not a median, so a handful of large sales moves it more than a typical sale does.
Over twelve months the district is still up, but only by 1.4%. That is behind England at 1.8% and well behind Warwickshire as a whole at 2.7%.
Three months of small falls
Stratford-on-Avon’s average peaked at £399,226 in March 2026, the highest figure in the index for the district. It has fallen every month since: 0.1% in April, 0.5% in May and 1.0% in June.
Across England, 113 of the 295 local authority districts recorded a monthly fall in June. Stratford-on-Avon’s 1.0% drop was the 39th steepest of them.
The only faller in Warwickshire
Every other district in the county rose in June.
| District | Average | Change on the month | Change on the year |
|---|---|---|---|
| Stratford-on-Avon | £392,574 | -1.0% | +1.4% |
| Warwick | £372,922 | +1.6% | +4.7% |
| Rugby | £276,208 | +0.5% | +0.2% |
| North Warwickshire | £270,450 | +0.6% | +2.7% |
| Nuneaton and Bedworth | £230,734 | +1.0% | +4.2% |
| Warwickshire | £308,618 | +0.5% | +2.7% |
| England | £293,262 | +0.2% | +1.8% |
Stratford-on-Avon remains the most expensive district in the county and the 81st dearest of England’s 295 districts. But the gap with Warwick has closed by more than a third in a year. In June 2025 the average Stratford home cost £30,896 more than the average Warwick one. In June 2026 it cost £19,652 more.
Look over the district boundary and the picture is mixed rather than regional. Wychavon is up 5.6% on the year and Cherwell 3.8%, while West Oxfordshire is down 1.5% and Redditch down 0.5%.
Flats are the only type falling
| Type | Average | Change on the year |
|---|---|---|
| Detached | £603,986 | +0.7% |
| Semi-detached | £366,948 | +2.4% |
| Terraced | £290,117 | +2.3% |
| Flat or maisonette | £188,888 | -0.4% |
| First-time buyer | £304,437 | +2.0% |
The detached figure matters more here than it would elsewhere, because this is a large rural district where detached houses make up a big share of sales. Detached homes rose just 0.7% over the year, the weakest of the four types apart from flats, and at £603,986 they cost more than three times the average flat.
We published a figure that has since been revised
When the May release came out we reported the district average as £392,880, up 2.8% in a year. The June release revises May upward to £396,710, up 3.8%, a change of £3,830.
That is normal rather than an error. HM Land Registry keeps adding completed sales to a month after it first publishes it, so a first release is provisional and smaller districts move more. We are noting it because it changes the shape of the story: the annual rate did not drift down from 2.8% to 1.4%, it dropped from a revised 3.8%.
What it means for you
- If you are selling, the level matters more than the monthly wobble. At £392,574 the district average is within £7,000 of its all-time high, and 1.4% above where it was a year ago. Three small monthly falls are not a slump.
- If you are buying, the flat market is the one that has actually moved. Flats and maisonettes are down 0.4% over the year at £188,888, the only type in the district that is cheaper than it was.
- If you are a first-time buyer, the district’s first-time buyer average is £304,437, up 2.0%. That is high for the region and reflects how little of the district’s housing stock is at the cheaper end.
- Do not read a single month as a trend. Every figure here will be revised, and the smaller the area the bigger the revision tends to be.
Sales volumes lag the price data by about three months. The most recent publishable month is April 2026, when 135 homes changed hands in the district, against a run of 205 to 210 a month through the autumn of 2025. Comparisons with spring 2025 are distorted by the stamp duty threshold change on 1 April that year: the district recorded 413 sales in March 2025 and 100 in April.
Our Stratford house prices page sets out how the district’s towns compare with each other and why the two figures people quote for Stratford are nearly £45,000 apart.
Sources
- HM Land Registry UK House Price Index, Stratford-on-Avon, June 2026 release, for the district average, the monthly and annual changes, the property-type splits and the first-time buyer average.
- The UK HPI full file for June 2026 (CSV), for the comparison with every other English district, the county and national figures, the thirteen-month series in the chart and the sales volumes.
- The UK HPI full file for May 2026 (CSV), for the May figure as first published, against which the revision above is measured.
UK House Price Index figures are mean averages of completed sales and are revised in later releases. Checked 22 August 2026.
Update, 19 September 2026. HM Land Registry has since revised June’s district average down from the £392,574 published at the time to £390,743, making the monthly fall 1.5 per cent rather than 1.0 per cent. July’s figure, and what it says about the direction, are in our July house price report.
Have your say